

Posts
Are prometheus metrics enabled by default in the backend code?
Hi, are prometheus metrics enabled by default in the backend code or someone needs to compile by himself a build with the right flags to enable it?
Thank you
Upgrade from NC26 to 27.0.2: advices?
cross-posted from: https://lemmy.g97.top/post/82608
Hi, I want to upgrade my nextcloud instance from version 26.0.5 to 27.0.2. Any advice? In particular for what concerns software versions: actually I've installed php 8.1.18, postgreSQL 13.11, redis 6.0.16. Do I need to upgrade them?
Thank you!
Upgrade from NC26 to 27.0.2: advices?
Hi, I want to upgrade my nextcloud instance from version 26.0.5 to 27.0.2. Any advice? In particular for what concerns software versions: actually I've installed php 8.1.18, postgreSQL 13.11, redis 6.0.16. Do I need to upgrade them?
Thank you!
A way to see up/down votes?
Am I missing something or there isn't a way to show separately the count of up and down votes?

Apt, packages kept back: why and how to resolve it?
cross-posted from: https://lemmy.g97.top/post/56902
Hi, I've this situation when I apt upgrade. There are many pipewire-related packages kept back. Why? How can I solve it?
Thank you!
EDIT: dist-upgrade summary
EDIT2: Ok I solved it with
apt autoremove # only to remove old packages. it didn't solved the problem
apt update
apt dist-upgrade
Apt, packages kept back: why and how to resolve it?
Hi, I've this situation when I apt upgrade. There are many pipewire-related packages kept back. Why? How can I solve it?
Thank you!
Iran’s Claim Of Quantum Processor Draws Ridicule
cross-posted from: https://lemmy.g97.top/post/45846
It's an... FPGA (?)
 https://www.iranintl.com/en/202306086480Open linkView original on lemmy.g97.top
Mission Center: A rust clone of the Windows Task Manager
Why? I don't know, maybe someone here will like it.
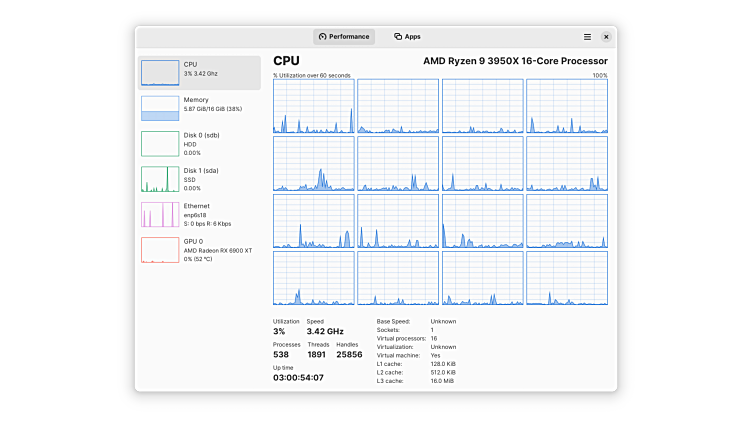 https://flathub.org/apps/io.missioncenter.MissionCenterOpen linkView original on lemmy.g97.top
How to monitor standard nginx accesses?
Hi! I would like to monitor accesses to my services done through my nginx setup that acts as reverse proxy.
I've tried fluentd to export Prometheus metrics with fluend to scrape the access.log file produced by nginx. The problem is that it uses a lot of resources as I can see (130+ MB of RAM only for fluentd, and each http request towards the fluentd metrics endpoint transfers a lot of data and I assume It Will increase consequently with the increase of the access.log file).
Is there any "embedded" scraper with integrated dashboard that I can recall on demand? For example, one of the problem with the previous solution is that peometheus scrapes the metrics every 5s so I have a constant transfer of different MBs every second due to the size of the metrics, even if I am not looking at grafana (my frontend for Prometheus). With an on demand service I would scrape the access.log file only when I am using the on demand service.
Thank you
Very slow IO performances: how to diagnose
cross-posted from: https://lemmy.g97.top/post/5839
EDIT: this is a full benchmark I run on my pool: https://gist.github.com/thegabriele97/9d82ddfbf0f4ec00dbcebc4d6cda29b3.
Hi! I ran into this issue since I started mu homelab adventure a couple of months ago, so I am still very noob, sorry for this.
I decided today to understand what happens and why it happens but I need your help to understand it better.
My homelab consists of a proxmox setup with three 1 TB HDD s in raidz1 (ZFS) (I know the downsides of this and I took my decisions) and 8 GB of RAM, of which 3.5 are assigned to a VM. The remaining parts are used by some LXC containers.
During high worloads (i.e. copying a file, downloading something via torrent/jdownloader) everything is very slow and other services start to be unresponsive due to the high IO delay.
I decided to test the three single devices with this command:
fio --ioengine=libaio --filename=/dev/sda --size=4G --time_based --name=fio --group_reporting --runtime=10 --direct=1 --sync=1 --iodepth=1 --rw=randread --bs=4k --numjobs=32And more or less they (sda, sdb, sdc) give this results:
Jobs: 32 (f=32): [r(32)][100.0%][r=436KiB/s][r=109 IOPS][eta 00m:00s]
fio: (groupid=0, jobs=32): err= 0: pid=3350293: Sat Jun 24 11:07:02 2023
  read: IOPS=119, BW=479KiB/s (490kB/s)(4968KiB/10378msec)
    slat (nsec): min=4410, max=40660, avg=12374.56, stdev=5066.56
    clat (msec): min=17, max=780, avg=260.78, stdev=132.27
     lat (msec): min=17, max=780, avg=260.79, stdev=132.27
    clat percentiles (msec):
     |  1.00th=[   26],  5.00th=[   50], 10.00th=[   80], 20.00th=[  140],
     | 30.00th=[  188], 40.00th=[  230], 50.00th=[  264], 60.00th=[  296],
     | 70.00th=[  326], 80.00th=[  372], 90.00th=[  430], 95.00th=[  477],
     | 99.00th=[  617], 99.50th=[  634], 99.90th=[  768], 99.95th=[  785],
     | 99.99th=[  785]
   bw (  KiB/s): min=  256, max=  904, per=100.00%, avg=484.71, stdev= 6.17, samples=639
   iops        : min=   64, max=  226, avg=121.14, stdev= 1.54, samples=639
  lat (msec)   : 20=0.32%, 50=4.91%, 100=8.13%, 250=32.85%, 500=49.68%
  lat (msec)   : 750=3.86%, 1000=0.24%
  cpu          : usr=0.01%, sys=0.00%, ctx=1246, majf=11, minf=562
  IO depths    : 1=100.0%, 2=0.0%, 4=0.0%, 8=0.0%, 16=0.0%, 32=0.0%, >=64=0.0%
     submit    : 0=0.0%, 4=100.0%, 8=0.0%, 16=0.0%, 32=0.0%, 64=0.0%, >=64=0.0%
     complete  : 0=0.0%, 4=100.0%, 8=0.0%, 16=0.0%, 32=0.0%, 64=0.0%, >=64=0.0%
     issued rwts: total=1242,0,0,0 short=0,0,0,0 dropped=0,0,0,0
     latency   : target=0, window=0, percentile=100.00%, depth=1

Run status group 0 (all jobs):
   READ: bw=479KiB/s (490kB/s), 479KiB/s-479KiB/s (490kB/s-490kB/s), io=4968KiB (5087kB), run=10378-10378msec

Disk stats (read/write):
  sda: ios=1470/89, merge=6/7, ticks=385624/14369, in_queue=405546, util=96.66%
Am I wrong or it is a very bad results? Why? The three identical HDs are this one: https://smarthdd.com/database/APPLE-HDD-HTS541010A9E662/JA0AB560/
I jope you can help me. Thank you!
Very slow IO performances: how to diagnose
EDIT: this is a full benchmark I run on my pool: https://gist.github.com/thegabriele97/9d82ddfbf0f4ec00dbcebc4d6cda29b3.
Hi! I ran into this issue since I started mu homelab adventure a couple of months ago, so I am still very noob, sorry for this.
I decided today to understand what happens and why it happens but I need your help to understand it better.
My homelab consists of a proxmox setup with three 1 TB HDD s in raidz1 (ZFS) (I know the downsides of this and I took my decisions) and 8 GB of RAM, of which 3.5 are assigned to a VM. The remaining parts are used by some LXC containers.
During high worloads (i.e. copying a file, downloading something via torrent/jdownloader) everything is very slow and other services start to be unresponsive due to the high IO delay.
I decided to test the three single devices with this command:
fio --ioengine=libaio --filename=/dev/sda --size=4G --time_based --name=fio --group_reporting --runtime=10 --direct=1 --sync=1 --iodepth=1 --rw=randread --bs=4k --numjobs=32
And more or less they (sda, sdb, sdc) give this results:
Jobs: 32 (f=32): [r(32)][100.0%][r=436KiB/s][r=109 IOPS][eta 00m:00s]
fio: (groupid=0, jobs=32): err= 0: pid=3350293: Sat Jun 24 11:07:02 2023
  read: IOPS=119, BW=479KiB/s (490kB/s)(4968KiB/10378msec)
    slat (nsec): min=4410, max=40660, avg=12374.56, stdev=5066.56
    clat (msec): min=17, max=780, avg=260.78, stdev=132.27
     lat (msec): min=17, max=780, avg=260.79, stdev=132.27
    clat percentiles (msec):
     |  1.00th=[   26],  5.00th=[   50], 10.00th=[   80], 20.00th=[  140],
     | 30.00th=[  188], 40.00th=[  230], 50.00th=[  264], 60.00th=[  296],
     | 70.00th=[  326], 80.00th=[  372], 90.00th=[  430], 95.00th=[  477],
     | 99.00th=[  617], 99.50th=[  634], 99.90th=[  768], 99.95th=[  785],
     | 99.99th=[  785]
   bw (  KiB/s): min=  256, max=  904, per=100.00%, avg=484.71, stdev= 6.17, samples=639
   iops        : min=   64, max=  226, avg=121.14, stdev= 1.54, samples=639
  lat (msec)   : 20=0.32%, 50=4.91%, 100=8.13%, 250=32.85%, 500=49.68%
  lat (msec)   : 750=3.86%, 1000=0.24%
  cpu          : usr=0.01%, sys=0.00%, ctx=1246, majf=11, minf=562
  IO depths    : 1=100.0%, 2=0.0%, 4=0.0%, 8=0.0%, 16=0.0%, 32=0.0%, >=64=0.0%
     submit    : 0=0.0%, 4=100.0%, 8=0.0%, 16=0.0%, 32=0.0%, 64=0.0%, >=64=0.0%
     complete  : 0=0.0%, 4=100.0%, 8=0.0%, 16=0.0%, 32=0.0%, 64=0.0%, >=64=0.0%
     issued rwts: total=1242,0,0,0 short=0,0,0,0 dropped=0,0,0,0
     latency   : target=0, window=0, percentile=100.00%, depth=1

Run status group 0 (all jobs):
   READ: bw=479KiB/s (490kB/s), 479KiB/s-479KiB/s (490kB/s-490kB/s), io=4968KiB (5087kB), run=10378-10378msec

Disk stats (read/write):
  sda: ios=1470/89, merge=6/7, ticks=385624/14369, in_queue=405546, util=96.66%
Am I wrong or it is a very bad results? Why? The three identical HDs are this one: https://smarthdd.com/database/APPLE-HDD-HTS541010A9E662/JA0AB560/
I jope you can help me. Thank you!
What happened to lemmy.world and lemmy.ml?
They went down for a lot of time. Are their downtimes linked somehow?