


Close calls at Michigan’s dams are a climate warning to [North] America
cross-posted from: https://toast.ooo/post/13895382
Flooding across northern Michigan last month pushed rivers to record levels, testing the limits of the state’s aging dams so severely that officials in one city nearly ordered evacuations as water threatened to spill over the top of a key barrier — a close call that highlights the growing risk that intensifying storms pose to similar infrastructure around the country.
Nationwide, the average dam is 64 years old and most were built for rainfall patterns that no longer reflect today’s changing climate. Thousands are classified as high hazard, meaning their failure could result in the loss of life. Dam safety experts say inspections are uneven and improvements often underfunded.
More than half of Michigan’s dams are beyond their 50-year design life, and the risks became clear as snowmelt and weeks of heavy rain swelled rivers. Rising water came within 5 inches of flowing over Cheboygan Dam in Cheboygan, a city of about 4,700 people, on April 16. In Bellaire, officials deployed about 1,000 sandbags to shore up a century-old dam.
“This needs to be considered not the worst we can experience. This needs to be considered as typical of the future,” said Richard Rood, a professor emeritus at the University of Michigan who studies climate change.
There are about 92,000 dams in the United States. About 18% are considered high-hazard. The Association of State Dam Safety Officials estimates repairing all of these aging structures will cost more than $165.2 billion. In Michigan, that estimate is $1 billion.
Communities facing these risks are left with difficult choices. Given the cost of repairing and upgrading dams to withstand stronger storms, removing them is often cheaper. That can reduce long-term risk and restore rivers to a more natural state. But it often faces resistance from property owners and communities with economies built around the reservoirs those dams created.
As floodwaters recede across Michigan, local leaders, dam safety advocates and experts are renewing calls to bolster safety regulations and deal with aging dams.
Bellaire Dam in Bellaire, Mich. on April 13, 2026
Austin Rowlader / IPR NewsBob Stuber, executive director of the Michigan Hydro Relicensing Commission, considers the April flooding a wake-up call and believes the solution is clear: upgrades where feasible and removal where it makes sense.
“I think every opportunity we have to remove an aging dam, we should take advantage of it because it’s not going to get better,” he said. “It’s just going to get worse.”
Officials in Traverse City came to that conclusion in 2024 and removed the Union Street Dam along the Boardman-Ottaway River as part of a decades-long restoration project that includes FishPass, which will allow key species to pass while blocking harmful invaders like sea lamprey. Engineers said that removal and upgrade most likely reduced flooding impacts when waters surged to near-record levels last month, falling just short of a 500-year flood.
“Upstream would have been under two more feet of water, which would have been quite devastating,” said Daniel Zielinski, a principal engineer for the Great Lakes Fishery Commission. “We actually had a really great stress test of the system. It functioned really well.”
Removals are increasing across the country, according to data from American Rivers. Since 2000, more dams have come down than gone up, and that pace is accelerating as aging infrastructure, safety concerns, and environmental benefits reshape how communities weigh their value.
In northern Michigan, conservation groups like Huron Pines help dam owners make that decision. It has managed nine removals in the last 13 years and has seen growing interest after the recent flooding, said Josh Leisen, a senior project manager for the organization. Removal reconnects river ecosystems and eliminates the need for expensive upkeep of aging structures, he said.
“There are costs associated with repair and there are risks associated with having a dam,” Leisen said. “Even if it seems to be in good condition, you get extreme weather events like we just had.”
Removing dams is not always straightforward. Beyond the technical challenges, many communities are reluctant to give up the lakes and waterfronts those structures create.
“There’s this emotional attachment to that impoundment,” said Daniel Brown, a climate resilience strategist at the Michigan-based Huron River Watershed Council.
In other cases, dismantling isn’t practical. Some dams provide electricity or drinking water, linking them to local economies and infrastructure. “(Removal) is not really something that’s on the table because they are connected in this very practical way,” Brown said.
Still, Brown said there are limits to how much aging structures can be adapted to a warming world. “(A dam) is this very long-term, huge, expensive infrastructure that you’ve put on the landscape that’s going to stay there. And that is not how climate change or nature or rivers behave,” Brown said.
Dismantling dams, like upgrading them, can come with steep costs. The Boardman-Ottaway River project — which removed three dams in the largest removal effort in state history — cost $25 million. Huron Pines is managing the removal of Sanback Dam in Rose City next month, at an estimated cost of $4 million.
Half of the expense is funded through a grant program from the Michigan Department of Environment, Energy and Great Lakes, or EGLE, launched in response to the 2020 Edenville Dam failure which overwhelmed the downstream Sanford Dam. The twin catastrophes forced the evacuation of more than 10,000 residents, destroyed thousands of homes and flooded ecosystems in a disaster that investigators later found was avoidable. The $44 million state program funded several dam removals, upgrades and engineering studies before it ended last year.
Neil Hawk and his wife Dawn take a rowboat out to a residential part of Sanford to inspect the damage to their neighborhood following extreme flooding throughout central Michigan on May 20, 2020 in Sanford, Michigan. Matthew Hatcher / Getty Images
Federal funding is available through programs administered by agencies such as FEMA or U.S. Army Corps of Engineers. But those resources fall short of the estimated $165.2 billion needed to address the issue, and some are at risk of elimination.
State governments regulate roughly 70 percent of the dams in the United States, with the federal government regulating hydropower dams and providing funding and guidance. This means inspection standards, regulations, enforcement, and resources can vary widely.
In Michigan, about 1,000 dams fall under state oversight, while 99 hydroelectric dams are overseen by the Federal Energy Regulatory Commission. The remaining 1,500 are smaller barriers that don’t fit the criteria for state regulation, according to the Michigan Dam Inventory.
Now, state officials are renewing calls for more money and stronger regulations. “Dam safety may be an issue that isn’t partisan,” said Phil Roos, director of EGLE.
Proposed state legislation would bolster inspection rules, address private ownership, update design standards, and create more funding opportunities for upgrades or removals. “It’s so important to our state that we can come together, and whether it’s passing the legislation that was proposed, or improving procedures or ultimately funding,” Roos said.
Michigan State Senator John Damoose has expressed concern about private dam ownership since the close call at Cheboygan Dam, which is under both state and private control. About 75 percent of the dams Michigan regulates are privately owned.
“Somebody made a point, ‘Well, we can’t have private companies owning these things.’ I tend to believe in private ownership but they might be right,” Damooose said during a Traverse City roundtable discussion on dam safety.
It’s not just a Michigan issue. Most dams in the United States are privately owned, meaning responsibility for maintenance, upkeep and potential failure falls on individuals, not governmental agencies, according to the Association of State Dam Safety Officials.
Climate change is expected to bring more frequent and intense storms. As the world warms, the atmosphere holds more moisture, fueling more intense precipitation, according to Rood at the University of Michigan.
“Recent flooding “has shown an incredible vulnerability,” he said. “(Dams) are either going to have to be removed or reengineered. Or they’re going to become a set of slowly unfolding failures.”
Luke Trumble, chief of dam safety for Michigan, said the state is already dealing with conditions that many dams were never designed to withstand.
“It’s a little bit of a misconception that if we fix the dam issue, there’ll be no more flooding,” Trumble said. “There’s still going to be flooding on rivers whenever we get rain like this, or rain on snow.”
“What we can do with dam safety legislation is help ensure that flooding is not made worse by a dam failure,” he said.
![Close calls at Michigan’s dams are a climate warning to [North] America](https://lemmy.world/pictrs/image/4a4fecc6-5c24-4274-a20a-078d65e6719d.jpeg) https://grist.org/extreme-weather/close-calls-at-michigans-dams-are-a-climate-warning-to-america/Open linkView original on slrpnk.net
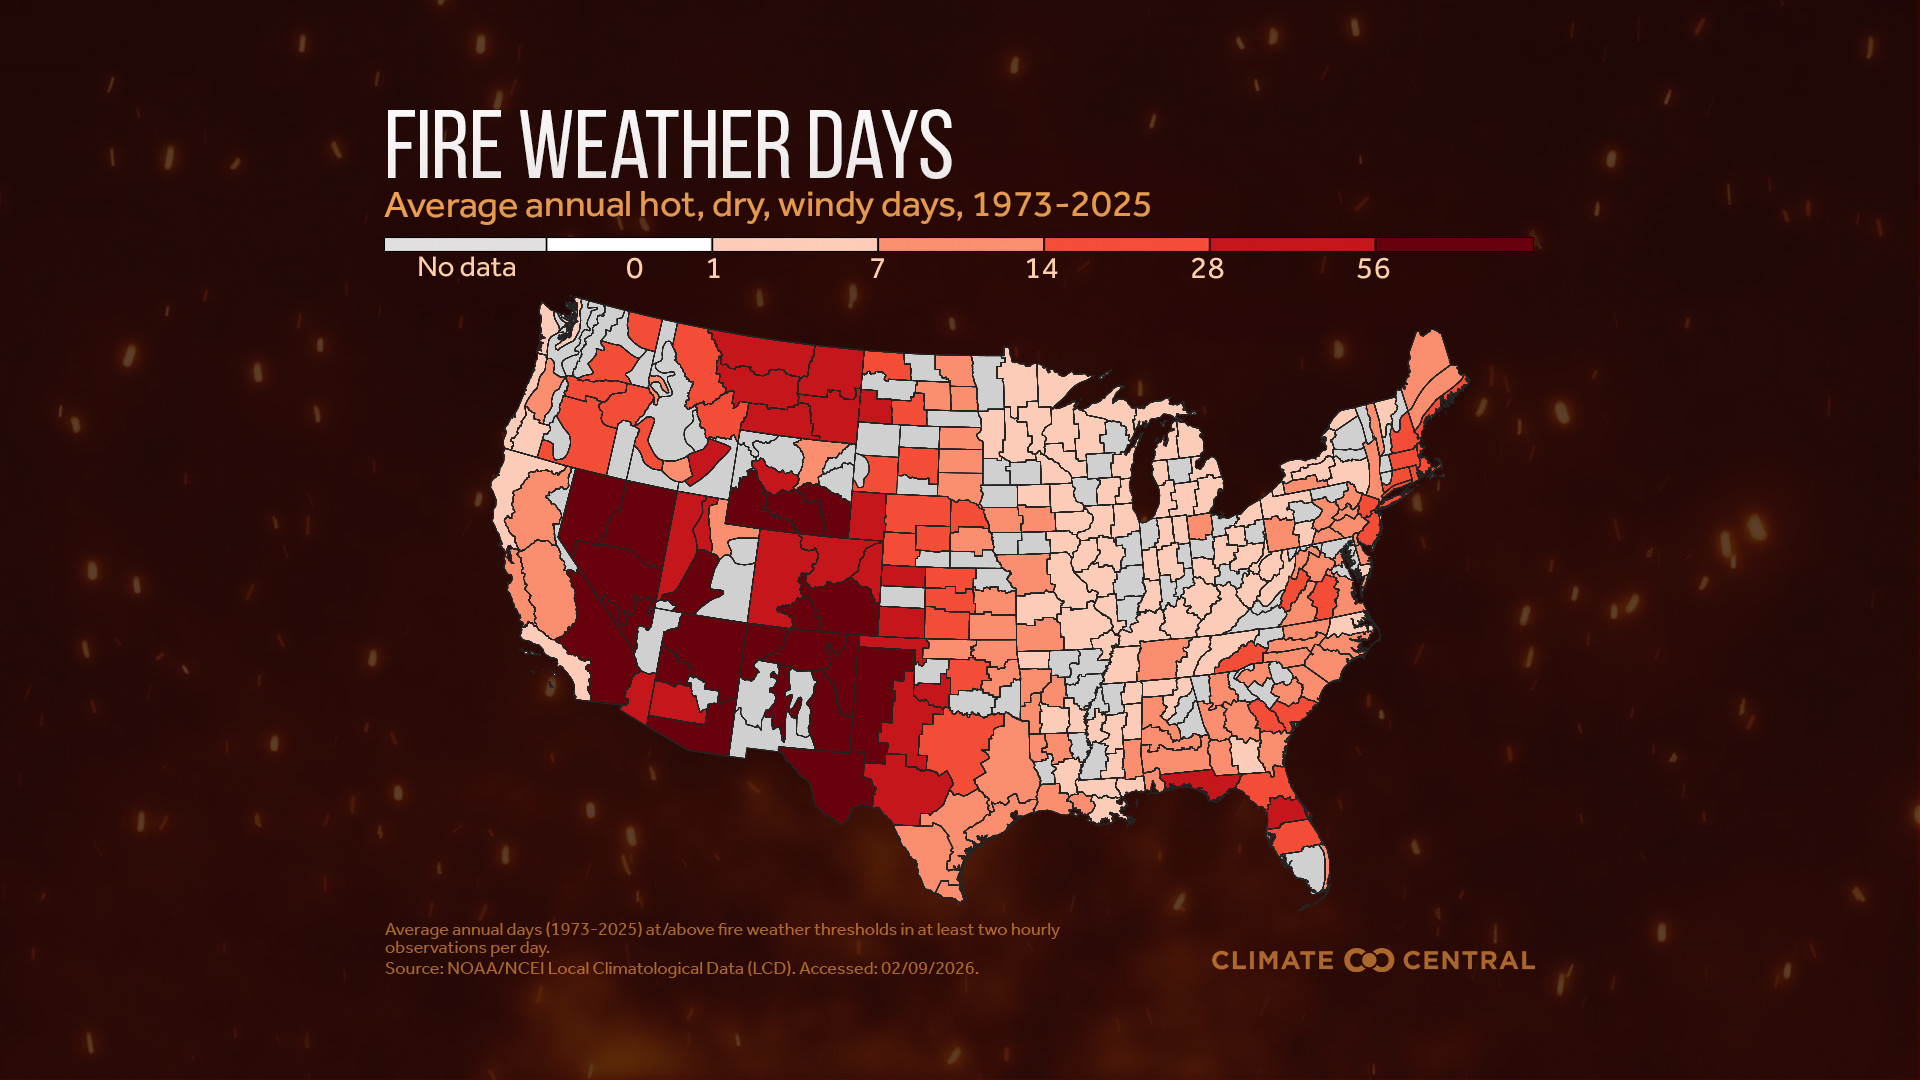
https://grist.org/extreme-weather/close-calls-at-michigans-dams-are-a-climate-warning-to-america/Open linkView original on slrpnk.netHere's where fire risk is changing in America.
Climate Central examined historical trends in fire weather — a combination of hot, dry, windy conditions — across the U.S.
This analysis uses data from 476 weather stations to assess fire weather trends in 245 climate divisions spanning the contiguous U.S. from 1973 to 2025.
On average, climate divisions in the western U.S. experience 32 fire weather days annually. That’s four times more than in the eastern U.S.
Wildfire seasons are lengthening and intensifying, particularly in the western U.S. Parts of the eastern U.S. have seen smaller but impactful increases in fire weather days.
Much of the country has seen fire weather increase the most during spring. The Southwest is also seeing more fire weather during summer.
 https://www.climatecentral.org/climate-matters/more-us-fire-weatherOpen linkView original on lemmy.world
Corpus Christi Plans to Declare a ‘Water Emergency.’ What Does That Mean?
cross-posted from: https://slrpnk.net/post/37592302
No modern American city has ever run out of water. But chances are rising that Corpus Christi, Texas, could be the first. Absent a biblical rainfall event, its reservoirs are on track to completely dry up by next year.
That raises baffling questions for the future of Texas’ eighth-largest city and one of the nation’s major petrochemical hubs.
 https://insideclimatenews.org/news/23042026/corpus-christi-water-emergency-explainer/Open linkView original on slrpnk.net
‘Point of no return’: New Orleans relocation must start now due to sea level, study finds
The process of relocating people from New Orleans should start immediately as the city has reached a “point of no return” that will see it surrounded by the ocean within decades due to the climate crisis, a stark new study has concluded.
Ongoing sea level rise and the rampant erosion of wetlands in southern Louisiana will swallow up the New Orleans area within a few generations, with the new paper estimating the city “may well be surrounded by the Gulf of Mexico before the end of this century”.
Low-lying southern Louisiana faces multiple threats, with rising sea levels driven by global heating, compounded by strengthening hurricanes, also a feature of the climate crisis, and the gradual subsidence of a coastline that has been carved apart by the oil and gas industry.
 https://www.theguardian.com/us-news/2026/may/04/new-orleans-sea-levels-relocation-climate-crisisOpen linkView original on slrpnk.net
Europe’s first climate migrants live in constant fear of extreme weather
Storm Daniel, which struck central Greece in September 2023, devastated the town of Palamas, leaving behind a chaotic mix of mud, debris, dead cattle, and shattered lives.
Vaios Giatropoulos moved with his family to a village where their home is on higher ground. Returning is unthinkable. “I don’t want to feel that sense of dread with every drop of rain. For several months, we feared it would flood again. I even thought about seeing a psychologist,” he recalls.
Giotopoulos belongs to a steadily expanding group of Europeans: the continent’s first climate migrants. Displacement within national borders is no longer an academic issue, as more people are affected by storms, floods, wildfires and droughts.
The Geneva-based NGO Internal Displacement Monitoring Centre (IDMC) estimates that approximately 413,000 people were displaced in the EU between 2008 and 2023. So far, 2023 has been the worst year on record, with over 200,000 Europeans internally displaced, mostly due to wildfires and storms.
 https://www.euronews.com/2026/05/02/a-sense-of-dread-europes-first-climate-migrants-live-in-constant-fear-of-extreme-weatherOpen linkView original on lemmy.world
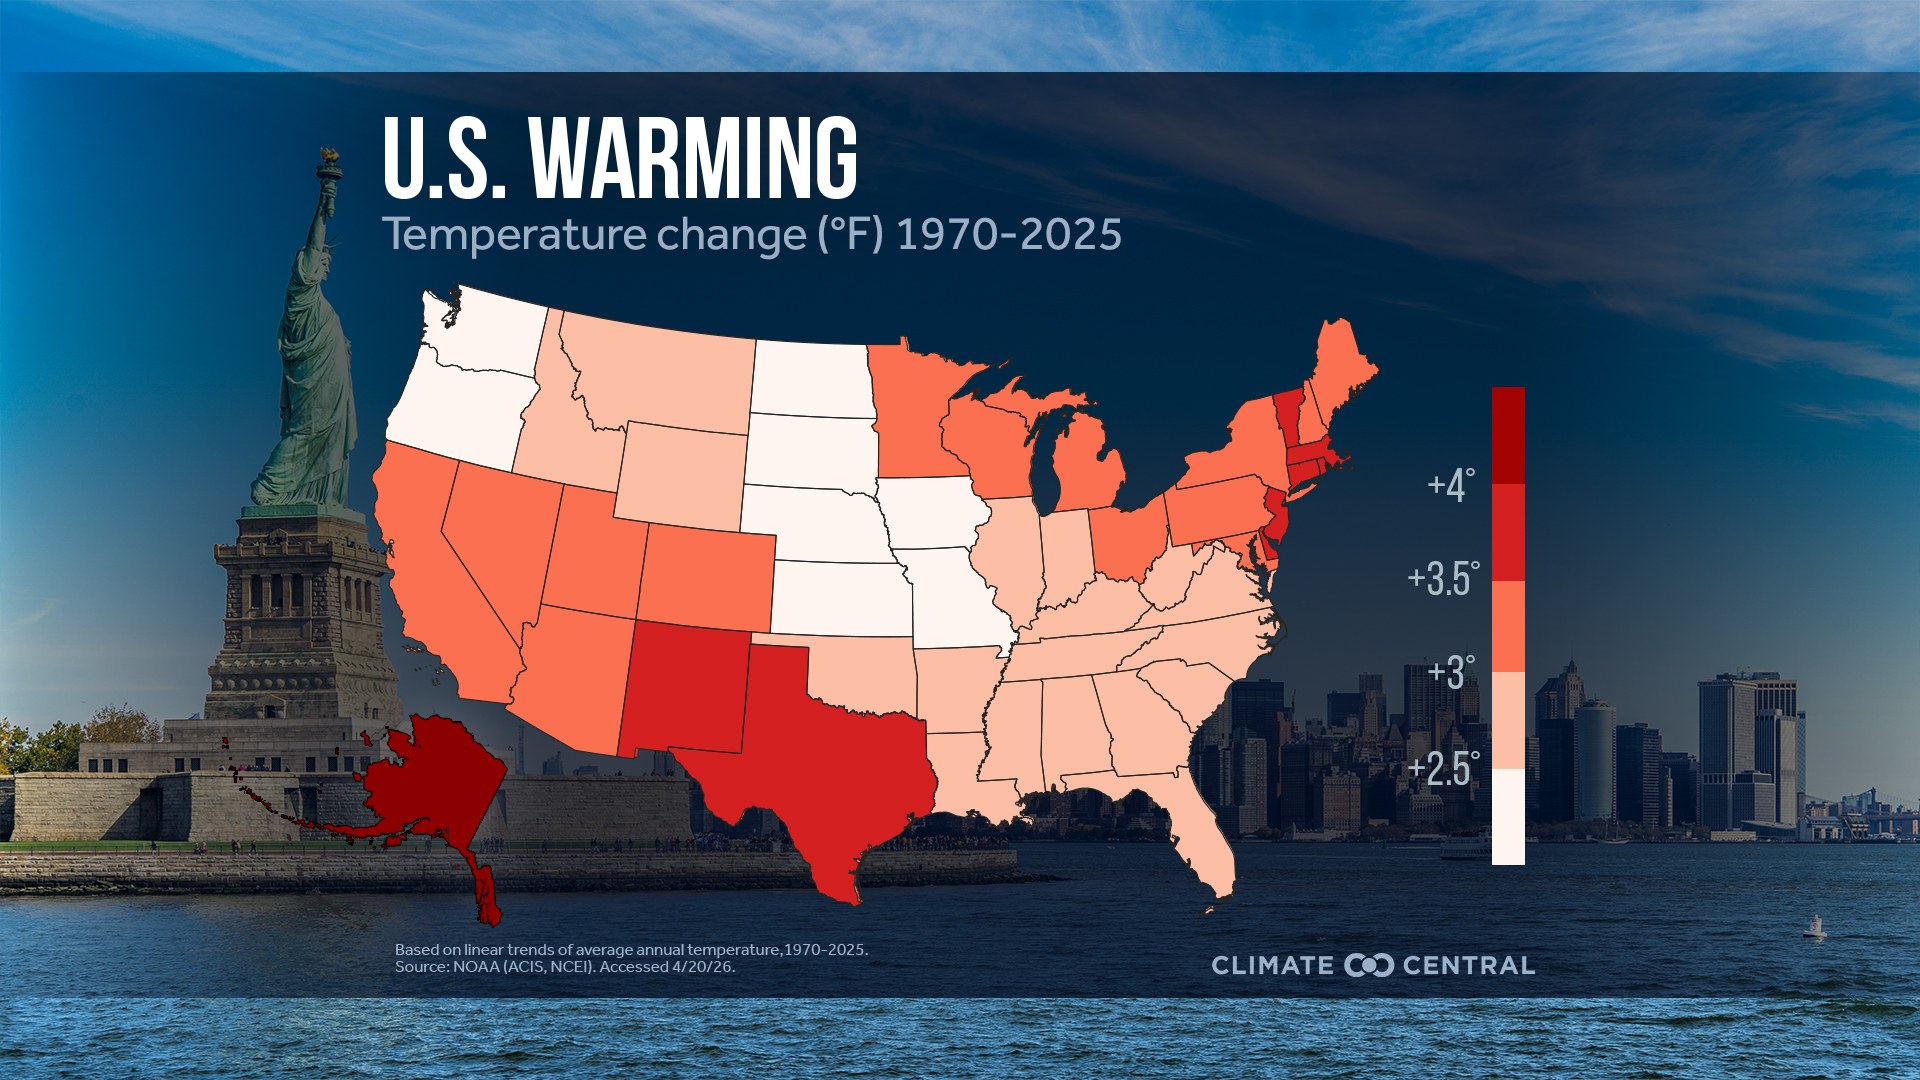
The Fastest-Warming U.S. States and Cities
Climate Central analyzed average annual temperature trends since 1970 in 49 states and 242 U.S. cities to understand how temperatures across the country have changed as heat-trapping pollution has continued to climb.
The fastest-warming U.S. states from 1970 to 2025 are:
- Alaska
- New Jersey
- New Mexico
- Delaware
- Massachusetts
- Vermont
The fastest-warming U.S. cities are:
- Reno, NV
- Las Vegas, NV
- El Paso, TX
- Burlington, VT
- Tyler, TX
This Climate Matters analysis is based on open-access data from the National Oceanic and Atmospheric Administration (NOAA). See Methodology for details.
 https://www.climatecentral.org/climate-matters/fastest-warming-us-cities-and-statesOpen linkView original on lemmy.world
Sinking Land Drives Hidden Flood Risk in One of the World’s Most Populated Regions
cross-posted from: https://sopuli.xyz/post/44290823
Fig. 1. a) Historical hurricane tracks that came within our search range (250 km of New York City: dashed circle). The categories shown are based on the Saffir-Simpson Hurricane Wind Scale (Saffir, 1973, Simpson, 1974). Storm track color denotes hurricane category at a given location (see key). b) Inset showing tree-ring site locations for 1. Montauk, New York, 2. Mashomack, New York, and 3. Newport, Rhode Island. c) The scanned sample image (top) compared to the image that was produced using quantitative wood anatomy methods (bottom). d) Close up of cell detail for 1977 and 1978 with inset highlighting vessel tylosis and detail on earlywood and latewood separation within a growth ring. The base map for panel (a) and (b) was produced on NOAA's Historical Hurricane Track interactive mapper: https://coast.noaa.gov/digitalcoast/tools/hurricanes.html
Fig. 2. Left: Residual (RES) tree-ring width chronologies from Montauk, New York (panel a), Newport, Rhode Island (panel b), and Mashomack, New York (panel c). Dashed vertical lines denote years of the most significant hurricane events around New York City (i.e., Category 2 or higher within the search radius). Right: Superposed Epoch Analysis showing the response of the normalized tree-ring width chronologies to the hurricane events, with colored uncertainty envelopes surrounding the black line representing the 5th and 95th percentiles of the growth response. The dashed and dotted lines refer to the 5th/95th and 1st/99th significance thresholds, respectively, using a random bootstrapping approach.
...
Importantly, the coastal oak chronologies do not show a strong climate signal from 1902 to 1999, except for Mashomack with a weakly significant and positive current-year signal with May/June precipitation (r = 0.26/0.26; p < 0.05) and SPEI-1 (r = 0.22/0.24, respectively; p < 0.05) (Fig. S2). Montauk shows a weakly positive correlation with previous year November/December precipitation (r = 0.23/0.22; p < 0.05) and November SPEI-1 (0.24; p < 0.05). Newport has weakly negative correlations with prior-year September precipitation (r = -0.27, p < 0.05) and SPEI-1 (r = -0.34, p < 0.05).
This is in contrast to inland tree-ring studies within the region that show stronger sensitivity to summer precipitation or drought variability (Levesque et al., 2017; Pederson et al., 2013). While the sheltered nature of Mashomack may provide an environmental niche more similar to inland forests allowing for the emergence of a weak summer climate signal, Montauk and Newport, seem to be insensitive to summer climate variability. Overall, although there were some significant correlations (p < 0.05) between climate variability from individual months and RW variability, correlations were weak (r < 0.3), some occurring in the previous year (t-1), and there were no notable correlation commonalities shared by the sites.
Our results fall in line with prior research in the region indicating that regional-scale climate variability is not the strongest limiting factor of radial growth of coastal trees. Rather, other environmental factors and ocean effects (Pearl et al., 2020; Tucker and Pearl, 2021) may play a more important role in their year-to-year radial growth. These trees are growing in a highly disturbance-prone region, very close to the sea, and subject to strong winds and salt spray. Paleotempestological tree-ring studies from more climate sensitive regions had success isolating a hurricane signature after removing the climate signal from the tree-ring data (Collins-Key and Altman, 2021). This filtering was not necessary here given the lack of strong climate signals across the sites.
...
Our study demonstrates that ring-width records from oak trees (Quercus spp.) growing at several coastal sites in New York and Rhode Island, and one beech site (Fagus grandifolia) from Massachusetts, capture major historical hurricane events over the 19th and 20th centuries. This is manifested by severely reduced ring width and latewood width, and for the Montauk site, relatively high lumen area ratio values in the year following the storm. In combination, this multi-parameter approach could help us better pin-point hurricane events prior to the observational record, particularly the strongest storms–Category 3 and larger in the tree-ring record.
Our results also show that wood anatomy from white oak (Quercus alba) from coastal forests, has strong potential in terms of hurricane detection, providing a critical first step in developing a protocol for analyzing these forests. Future studies could benefit from additional parameters (e.g., stable isotopes, additional anatomical traits), and/or other paleotempestological proxies (e.g., sediment cores), to develop a better understanding of historical hurricane activity across the northeastern United States.
Our findings also indicate that these forests demonstrate a remarkable capacity for recovery following large-scale disturbances, such as hurricanes. Unlike studies of conifers (Tucker et al., 2018; Fernandes et al., 2018), we found that oak and beech trees from Montauk, Newport, and Naushon Island sites had fully regained their radial growth by the second growing season after a hurricane, with trees at Mashomack only slightly lagging this rapid recovery. This suggests a high tolerance to disturbance for oaks (4 sites) and beech (1 site). Future investigations require more sites from a variety of tree species to elucidate differences in hurricane response depending on forest types (e.g. conifers vs angiosperms).
Despite the resilience of coastal forests to hurricane impacts, these forests are increasingly at risk from storm damage and surges, and continued sea-level rise. We would expect that compound events and stressors, such as sea-level rise, storm surges, and physical damage from hurricanes, could further alter site conditions beyond the thresholds these ecosystems can tolerate. Our results show that forest growth is already negatively correlated with sea-level height anomalies. Given the critical role these forests play in the sustainability of densely populated communities—by buffering wind, supporting dune infrastructure, enhancing groundwater recharge, and sustaining wildlife—greater attention is needed to study and protect remaining coastal forests.
link to open access article..
https://www.sciencedirect.com/science/article/pii/S092181812600144X
 https://news.climate.columbia.edu/2026/04/08/sinking-land-drives-hidden-flood-risk-in-one-of-the-worlds-most-populated-regions/Open linkView original on slrpnk.net
Water conservation works, but climate change is outpacing it: Phoenix, Denver and Las Vegas offer a glimpse of the future
cross-posted from: https://slrpnk.net/post/36310032
For example, under a plausible, moderately high emissions scenario, Phoenix’s available surface water supply was forecast to drop below the historical average by 2060. Even when we simulated higher participation in conservation programs, there was no noticeable change in the water availability, suggesting that any savings from reducing demand were counteracted by losses from upstream flow reductions. Encouraging people to use less water is a start, but there is a limit to how much people can conserve.
We found similar results in Denver under a moderate emissions scenario and in Las Vegas under a moderately high emissions scenario, indicating that even moderate climate change could lead to extreme scarcity conditions that are not manageable through demand-side changes alone.
 https://theconversation.com/water-conservation-works-but-climate-change-is-outpacing-it-phoenix-denver-and-las-vegas-offer-a-glimpse-of-the-future-279837Open linkView original on slrpnk.net

Temperatures Are Soaring in the Western United States. Climate Change is to Blame, Says a New Report. - Eos
cross-posted from: https://sopuli.xyz/post/42994044
Heatwaves of this scale, the report forecasts, are expected to occur just once every 500 years. Such rare occurrences make it challenging for researchers to estimate how often these events might happen if the climate warms further. But the current attribution study estimates that, if the climate warms another 1.3°C, heat events so extreme that they are forecasted to happen just once every 100 years will become 6.4 times more likely and 1.8°C hotter.
 https://eos.org/research-and-developments/temperatures-are-soaring-in-the-western-united-states-climate-change-is-to-blame-says-a-new-reportOpen linkView original on slrpnk.net
Heatwave scorching US west ‘virtually impossible’ without climate crisis, say scientists | Unseasonably warm and even dangerous temperatures this week were up to 30F above average for the time of year
 https://www.theguardian.com/us-news/2026/mar/20/heatwave-us-west-climate-crisisOpen linkView original on slrpnk.net